# lets-plot
**Repository Path**: mirrors_JetBrains/lets-plot
## Basic Information
- **Project Name**: lets-plot
- **Description**: Multiplatform plotting library based on the Grammar of Graphics
- **Primary Language**: Unknown
- **License**: MIT
- **Default Branch**: master
- **Homepage**: None
- **GVP Project**: No
## Statistics
- **Stars**: 0
- **Forks**: 1
- **Created**: 2020-08-09
- **Last Updated**: 2026-04-18
## Categories & Tags
**Categories**: Uncategorized
**Tags**: None
## README
# Lets-Plot
[](https://confluence.jetbrains.com/display/ALL/JetBrains+on+GitHub)
[](https://raw.githubusercontent.com/JetBrains/lets-plot-kotlin/master/LICENSE)
[](https://github.com/JetBrains/lets-plot/releases/latest)
**Lets-Plot** is a multiplatform plotting library built on the principles of the Grammar of Graphics.
The library design is heavily influenced by Leland Wilkinson's work [The Grammar of Graphics](https://www.goodreads.com/book/show/2549408.The_Grammar_of_Graphics) describing the deep features that underlie all statistical graphics.
> This grammar [...] is made up of a set of independent components that can be composed in many different ways. This makes [it] very powerful because you are not limited to a set of pre-specified graphics, but you can create new graphics that are precisely tailored for your problem.
> - Hadley Wickham, "[ggplot2: Elegant Graphics for Data Analysis](https://ggplot2-book.org/index.html)"
## Grammar of Graphics for Python [](https://pypi.org/project/lets-plot)
A bridge between R (ggplot2) and Python data visualization. \
To learn more, see the documentation site at **[lets-plot.org/python](https://lets-plot.org/python)**.
## Grammar of Graphics for Kotlin [](https://github.com/JetBrains/lets-plot-kotlin/releases/latest)
### Notebooks
Create plots in [Kotlin Notebook](https://plugins.jetbrains.com/plugin/16340-kotlin-notebook),
[Datalore](https://datalore.jetbrains.com/report/static/HZqq77cegYd.E7get_WnChZ/aTA9lQnPkRwdCzT6uy95GZ), [Jupyter with Kotlin Kernel](https://github.com/Kotlin/kotlin-jupyter#readme) \
or any other notebook that supports `Kotlin Kernel`. \
To learn more, see the **[Lets-Plot Kotlin API](https://github.com/JetBrains/lets-plot-kotlin)** project at GitHub.
### Compose Multiplatform
Embed Lets-Plot charts in [Compose Multiplatform](https://github.com/JetBrains/compose-multiplatform) applications. \
To learn more, see the **[Lets-Plot Compose Frontend](https://github.com/JetBrains/lets-plot-compose)** project at GitHub.
### JVM and Kotlin/JS
Embed Lets-Plot charts in JVM (Swing, JavaFX) and Kotlin/JS applications.
To learn more, see the **[Lets-Plot Kotlin API](https://github.com/JetBrains/lets-plot-kotlin)** project at GitHub.
### Documentation
Kotlin API documentation site: [lets-plot.org/kotlin](https://lets-plot.org/kotlin).
## "Lets-Plot in SciView" plugin
[](http://plugins.jetbrains.com/plugin/14379-lets-plot-in-sciview)
[](http://plugins.jetbrains.com/plugin/14379-lets-plot-in-sciview)
*Scientific mode* in PyCharm and in IntelliJ IDEA provides support for interactive scientific computing and data visualization.
[*Lets-Plot in SciView*](https://plugins.jetbrains.com/plugin/14379-lets-plot-in-sciview) plugin adds
support for interactive plotting to IntelliJ-based IDEs with the *Scientific mode* enabled.
>
> **Note:** The *Scientific mode* is NOT available in communinty editions of JetBrains IDEs.
>
Also read:
- [Scientific mode in PyCharm](https://www.jetbrains.com/help/pycharm/matplotlib-support.html)
- [Scientific mode in IntelliJ IDEA](https://www.jetbrains.com/help/idea/matplotlib-support.html)
## What is new in 4.9.0
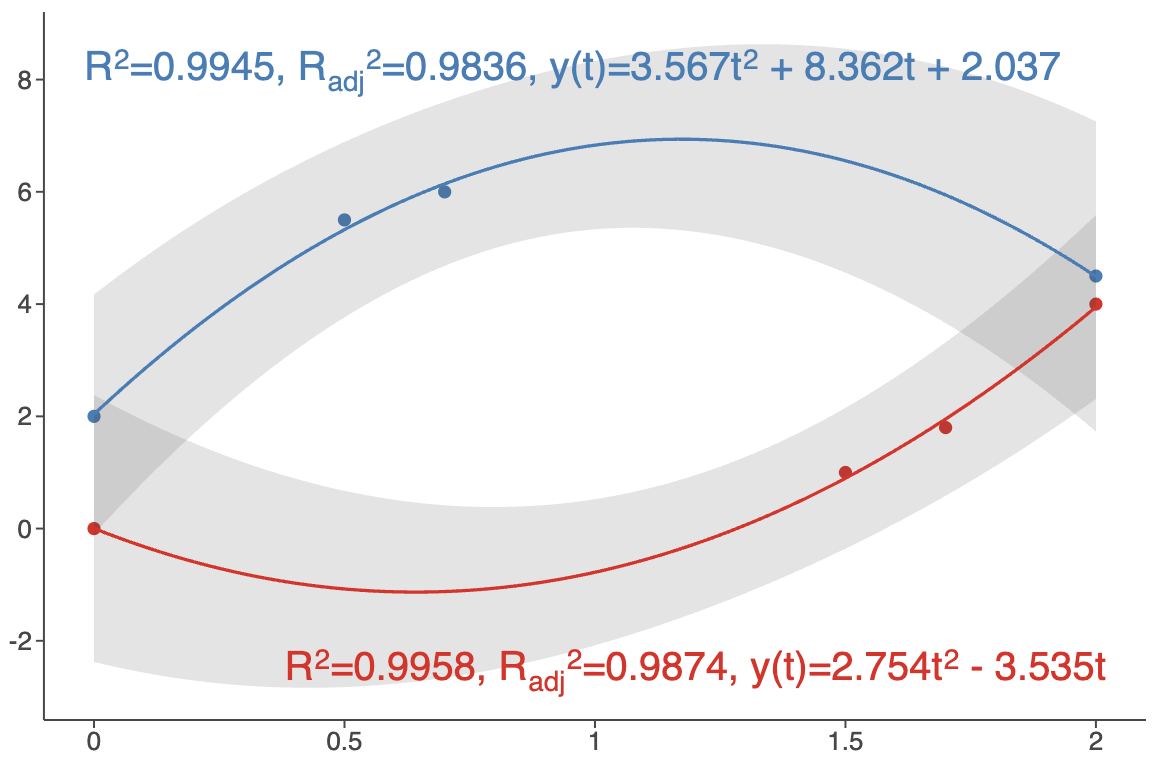
- #### Statistical Summaries Directly on `geom_smooth()` Plot Layer
The `geom_smooth()` layer now includes a `labels` parameter designed to display statistical summaries of the fitted model directly on the plot. \
This parameter accepts a `smooth_labels()` object, which provides access to model-specific variables like $R^2$ and the regression equation.
 See [example notebook](https://raw.githack.com/JetBrains/lets-plot/master/docs/f-26a/smooth_summary.html).
- #### Plot Tags
Plot tags are short labels attached to a plot.
See [example notebook](https://raw.githack.com/JetBrains/lets-plot/master/docs/f-26a/smooth_summary.html).
- #### Plot Tags
Plot tags are short labels attached to a plot.
 See [example notebook](https://raw.githack.com/JetBrains/lets-plot/master/docs/f-26a/plot_tags.html).
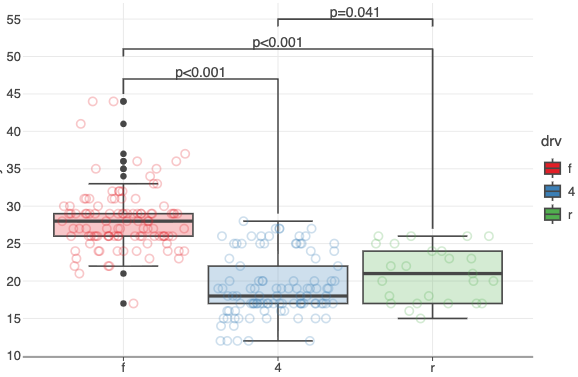
- #### New `geom_bracket()` and `geom_bracket_dodge()` Geometries
New geometries designed primarily for significance bars (*p-values*) annotations in categorical plots.
See [example notebook](https://raw.githack.com/JetBrains/lets-plot/master/docs/f-26a/plot_tags.html).
- #### New `geom_bracket()` and `geom_bracket_dodge()` Geometries
New geometries designed primarily for significance bars (*p-values*) annotations in categorical plots.
 See: [example notebook](https://raw.githack.com/JetBrains/lets-plot/master/docs/f-26a/geom_bracket.html).
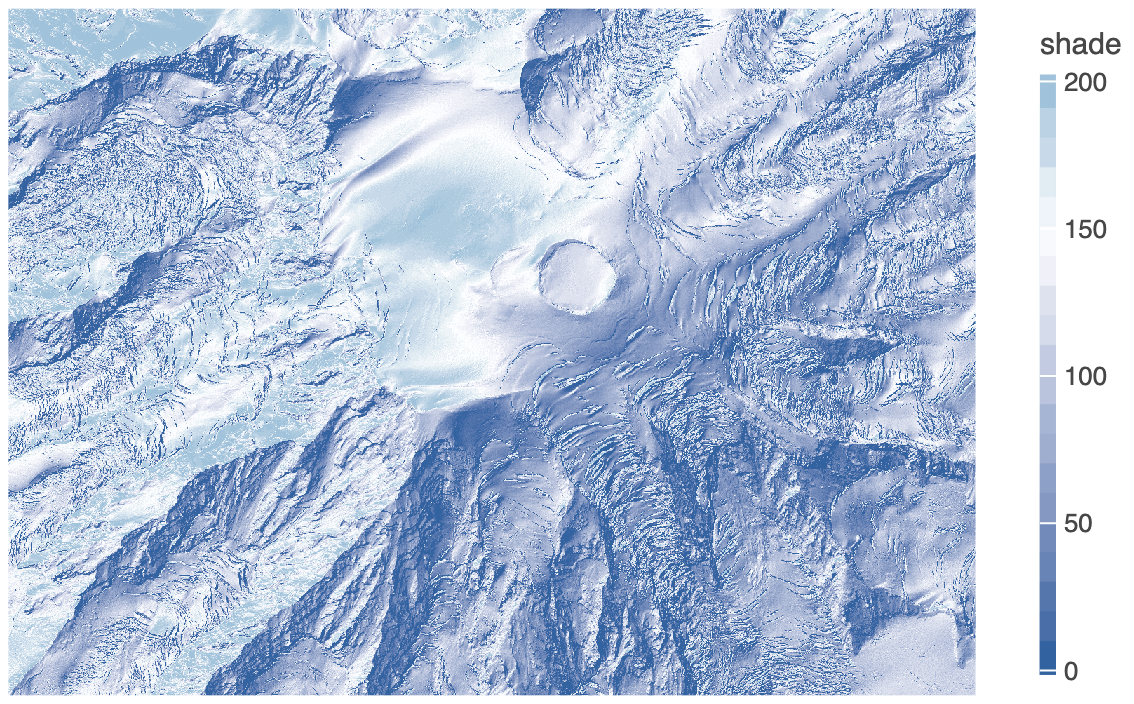
- #### Custom Color Palettes in `geom_imshow()`
The `cmap` parameter now allows you to specify a list of hex color codes for visualizing grayscale images. \
Also, the new `cguide` parameter lets you customize the colorbar for grayscale images.
See: [example notebook](https://raw.githack.com/JetBrains/lets-plot/master/docs/f-26a/geom_bracket.html).
- #### Custom Color Palettes in `geom_imshow()`
The `cmap` parameter now allows you to specify a list of hex color codes for visualizing grayscale images. \
Also, the new `cguide` parameter lets you customize the colorbar for grayscale images.
 See [example notebook](https://raw.githack.com/JetBrains/lets-plot/master/docs/f-26a/image_custom_cmap.html).
- #### New `palette()` Method in Color Scales
Generates a list of hex color codes that can be used with `scale_color_manual()` to maintain consistent colors across multiple plots.
See: [example notebook](https://raw.githack.com/JetBrains/lets-plot/master/docs/f-26a/scale_color_palette.html).
- #### New `overflow` parameter in `scale_color_brewer()`, `scale_fill_brewer()`
Controls how colors are generated when more colors are needed than the palette provides. \
Options: `'interpolate'` (`'i'`), `'cycle'` (`'c'`), `'generate'` (`'g'`).
See: [example notebook](https://raw.githack.com/JetBrains/lets-plot/master/docs/f-26a/scale_brewer_overflow.html).
- #### New `break_width` Parameter in Positional Scales
Specifies a fixed distance between axis breaks.
See examples:
- [datetime scale](https://raw.githack.com/JetBrains/lets-plot/master/docs/f-26a/scale_break_width_datetime.html)
- [time (duration) scale](https://raw.githack.com/JetBrains/lets-plot/master/docs/f-26a/scale_break_width_duration.html)
- [log10 scale](https://raw.githack.com/JetBrains/lets-plot/master/docs/f-26a/scale_break_width_log10.html)
- #### Axis Minor Ticks Customization
The `axis_minor_ticks` and `axis_minor_ticks_length` parameters in `theme()`.
See: [example notebook](https://raw.githack.com/JetBrains/lets-plot/master/docs/f-26a/axis_minor_ticks.html).
- #### Pan/Zoom in `gggrid()` with Shared Axes
Pan/Zoom now propagates across subplots with shared axes (`sharex`/`sharey`).
See: [example notebook](https://raw.githack.com/JetBrains/lets-plot/master/docs/f-26a/gggrid_scale_share_zoom.html).
- #### And More
See [CHANGELOG.md](https://github.com/JetBrains/lets-plot/blob/master/CHANGELOG.md) for a full list of changes.
## Recent Updates in the [Gallery](https://lets-plot.org/python/pages/gallery.html)
See [example notebook](https://raw.githack.com/JetBrains/lets-plot/master/docs/f-26a/image_custom_cmap.html).
- #### New `palette()` Method in Color Scales
Generates a list of hex color codes that can be used with `scale_color_manual()` to maintain consistent colors across multiple plots.
See: [example notebook](https://raw.githack.com/JetBrains/lets-plot/master/docs/f-26a/scale_color_palette.html).
- #### New `overflow` parameter in `scale_color_brewer()`, `scale_fill_brewer()`
Controls how colors are generated when more colors are needed than the palette provides. \
Options: `'interpolate'` (`'i'`), `'cycle'` (`'c'`), `'generate'` (`'g'`).
See: [example notebook](https://raw.githack.com/JetBrains/lets-plot/master/docs/f-26a/scale_brewer_overflow.html).
- #### New `break_width` Parameter in Positional Scales
Specifies a fixed distance between axis breaks.
See examples:
- [datetime scale](https://raw.githack.com/JetBrains/lets-plot/master/docs/f-26a/scale_break_width_datetime.html)
- [time (duration) scale](https://raw.githack.com/JetBrains/lets-plot/master/docs/f-26a/scale_break_width_duration.html)
- [log10 scale](https://raw.githack.com/JetBrains/lets-plot/master/docs/f-26a/scale_break_width_log10.html)
- #### Axis Minor Ticks Customization
The `axis_minor_ticks` and `axis_minor_ticks_length` parameters in `theme()`.
See: [example notebook](https://raw.githack.com/JetBrains/lets-plot/master/docs/f-26a/axis_minor_ticks.html).
- #### Pan/Zoom in `gggrid()` with Shared Axes
Pan/Zoom now propagates across subplots with shared axes (`sharex`/`sharey`).
See: [example notebook](https://raw.githack.com/JetBrains/lets-plot/master/docs/f-26a/gggrid_scale_share_zoom.html).
- #### And More
See [CHANGELOG.md](https://github.com/JetBrains/lets-plot/blob/master/CHANGELOG.md) for a full list of changes.
## Recent Updates in the [Gallery](https://lets-plot.org/python/pages/gallery.html)


 ## Change Log
[CHANGELOG.md](https://github.com/JetBrains/lets-plot/blob/master/CHANGELOG.md)
## Code of Conduct
This project and the corresponding community are governed by the
[JetBrains Open Source and Community Code of Conduct](https://confluence.jetbrains.com/display/ALL/JetBrains+Open+Source+and+Community+Code+of+Conduct).
Please make sure you read it.
## License
Code and documentation released under the [MIT license](https://github.com/JetBrains/lets-plot/blob/master/LICENSE).
Copyright © 2019-2025, JetBrains s.r.o.
## Change Log
[CHANGELOG.md](https://github.com/JetBrains/lets-plot/blob/master/CHANGELOG.md)
## Code of Conduct
This project and the corresponding community are governed by the
[JetBrains Open Source and Community Code of Conduct](https://confluence.jetbrains.com/display/ALL/JetBrains+Open+Source+and+Community+Code+of+Conduct).
Please make sure you read it.
## License
Code and documentation released under the [MIT license](https://github.com/JetBrains/lets-plot/blob/master/LICENSE).
Copyright © 2019-2025, JetBrains s.r.o.