# g6
**Repository Path**: fmic/g6
## Basic Information
- **Project Name**: g6
- **Description**: A Graph Visualization Framework in JavaScript
- **Primary Language**: JavaScript
- **License**: MIT
- **Default Branch**: dev2.2.7
- **Homepage**: None
- **GVP Project**: No
## Statistics
- **Stars**: 0
- **Forks**: 0
- **Created**: 2019-03-25
- **Last Updated**: 2020-12-19
## Categories & Tags
**Categories**: Uncategorized
**Tags**: None
## README
[](https://travis-ci.org/antvis/g6)


[](https://www.npmjs.com/package/@antv/g6)
[](https://npmjs.org/package/@antv/g6)
[](http://isitmaintained.com/project/antvis/g6 "Percentage of issues still open")
[English README](README.md)
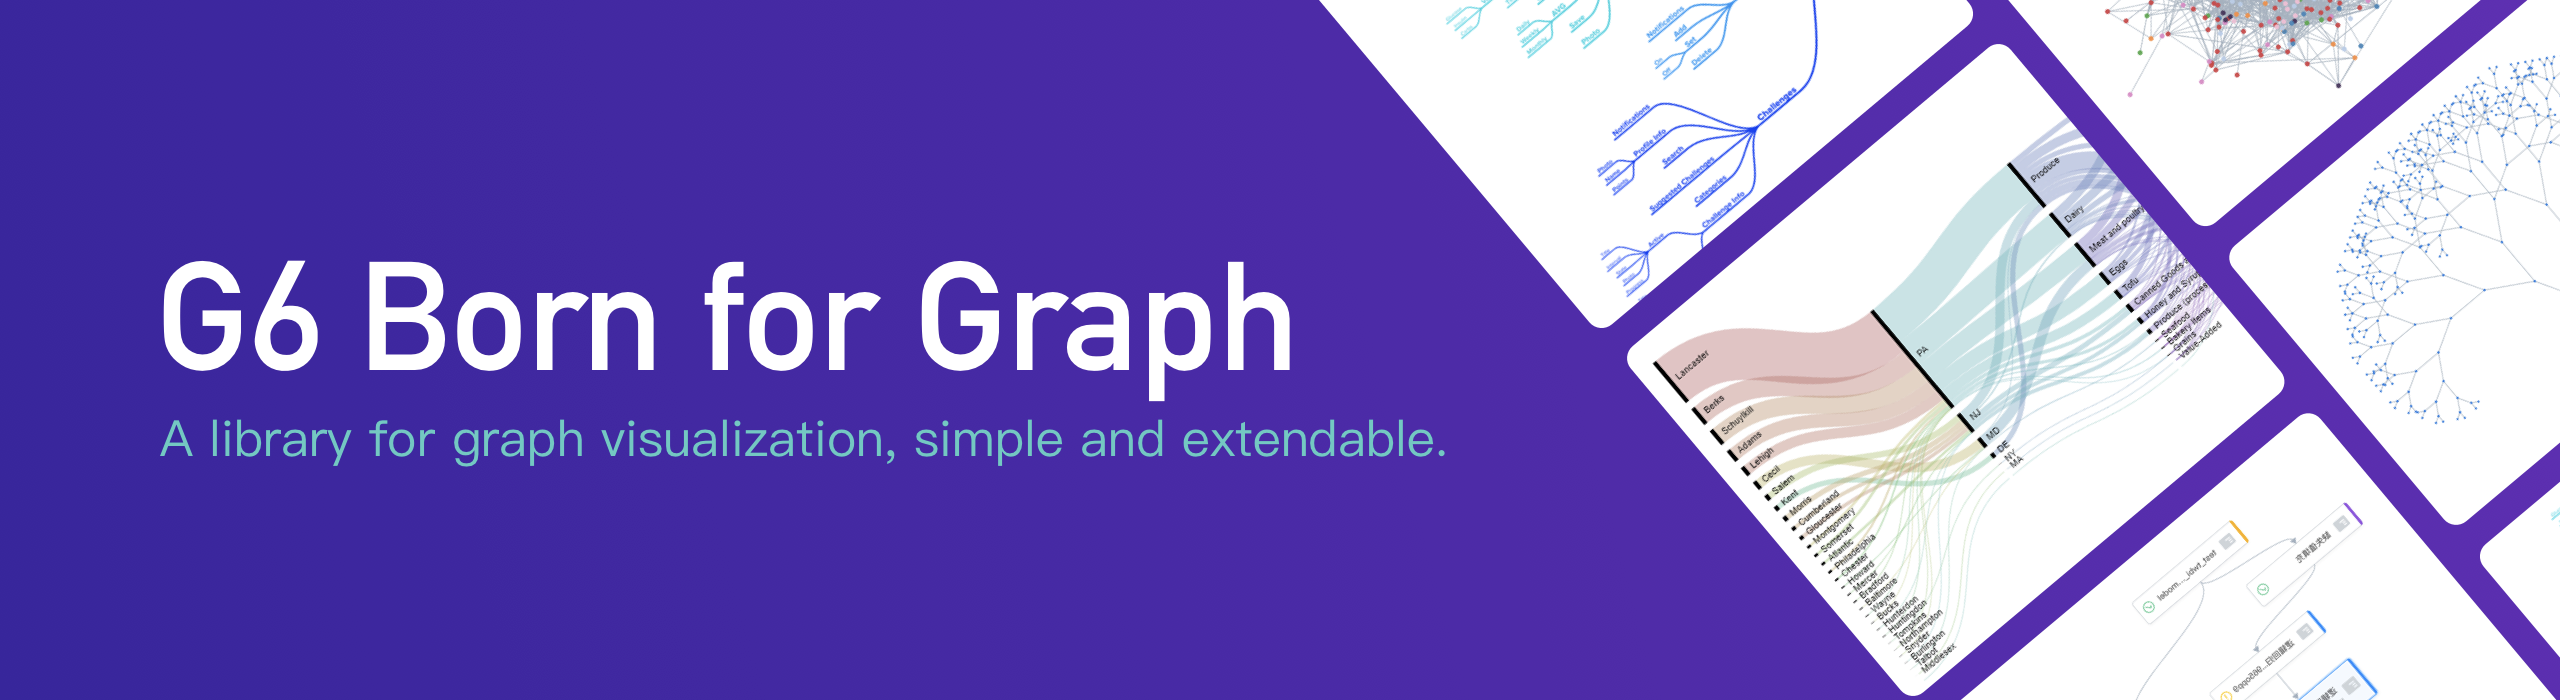
G6 是一个图可视化框架。它提供了一套图可视化的基础设置,能帮助开发者搭建属于自己的图 **图分析** 应用或是 **图编辑器** 应用。
**注意**: G6 3.0 版本带来了重大更新,目前正在beta测试中。欢迎开发者们试用,详情请见 [3.x文档](https://www.yuque.com/antv/g6/xauk5e)。
[2.x 完整文档](https://www.yuque.com/antv/g6/introduce)


 ## [G6-Editor](https://yuque.com/antv/g6-editor)

 ## G6-Analyzer [coming soon]

## 安装
```bash
$ npm install @antv/g6
```
## G6-Analyzer [coming soon]

## 安装
```bash
$ npm install @antv/g6
```
 ## Usage
```js
import G6 from '@antv/g6';
const data = {
nodes: [{
id: 'node1',
x: 100,
y: 200
},{
id: 'node2',
x: 300,
y: 200
}],
edges: [{
target: 'node2',
source: 'node1'
}]
};
const graph = new G6.Graph({
container: 'mountNode',
width: 500,
height: 500
});
graph.read(data);
```
## 开发
```bash
$ npm install
# run test case
$ npm run test-live
# build watching file changes and run demos
$ npm run dev
```
## 如何贡献
Please let us know how can we help. Do check out [issues](https://github.com/antvis/g6/issues) for bug reports or suggestions first.
请让我们知道您要解决或贡献什么,所以在贡献之前请先提交 [issues](https://github.com/antvis/g6/issues) 描述 bug 或建议。
成为一个贡献者前请阅读 [代码贡献规范](https://github.com/antvis/g6/blob/master/CONTRIBUTING.zh-CN.md).
## 体验改进计划说明
为了更好服务用户,G6 会将 URL 和版本信息发送回 AntV 服务器:
https://kcart.alipay.com/web/bi.do
除了 URL 与 G6 版本信息外,不会收集任何其他信息。如有担心,可以通过下面的代码关闭:
```js
// 关闭 G6 的体验改进计划打点请求
G6.track(false)
```
## License
[MIT license](./LICENSE).
## Usage
```js
import G6 from '@antv/g6';
const data = {
nodes: [{
id: 'node1',
x: 100,
y: 200
},{
id: 'node2',
x: 300,
y: 200
}],
edges: [{
target: 'node2',
source: 'node1'
}]
};
const graph = new G6.Graph({
container: 'mountNode',
width: 500,
height: 500
});
graph.read(data);
```
## 开发
```bash
$ npm install
# run test case
$ npm run test-live
# build watching file changes and run demos
$ npm run dev
```
## 如何贡献
Please let us know how can we help. Do check out [issues](https://github.com/antvis/g6/issues) for bug reports or suggestions first.
请让我们知道您要解决或贡献什么,所以在贡献之前请先提交 [issues](https://github.com/antvis/g6/issues) 描述 bug 或建议。
成为一个贡献者前请阅读 [代码贡献规范](https://github.com/antvis/g6/blob/master/CONTRIBUTING.zh-CN.md).
## 体验改进计划说明
为了更好服务用户,G6 会将 URL 和版本信息发送回 AntV 服务器:
https://kcart.alipay.com/web/bi.do
除了 URL 与 G6 版本信息外,不会收集任何其他信息。如有担心,可以通过下面的代码关闭:
```js
// 关闭 G6 的体验改进计划打点请求
G6.track(false)
```
## License
[MIT license](./LICENSE).